Seki Sequence:
Histograms from a 13x13 game
Ingo Althofer, January 19, 2016
The game is from round 15 of the KGS bot tournament on August 10, 2015.
White was Aya, Black was Zen. White won by 1.5 points.
The game was played with Chinese rules.
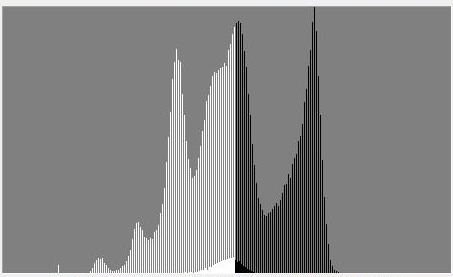
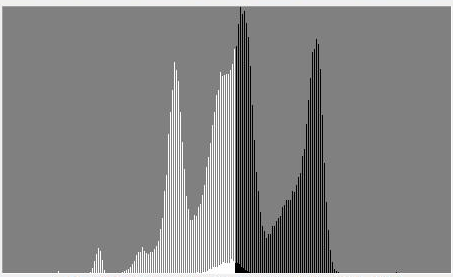
The diagrams below show the histograms of distribution of MC playouts,
generated by CrazyStone-2013 in analysis mode.
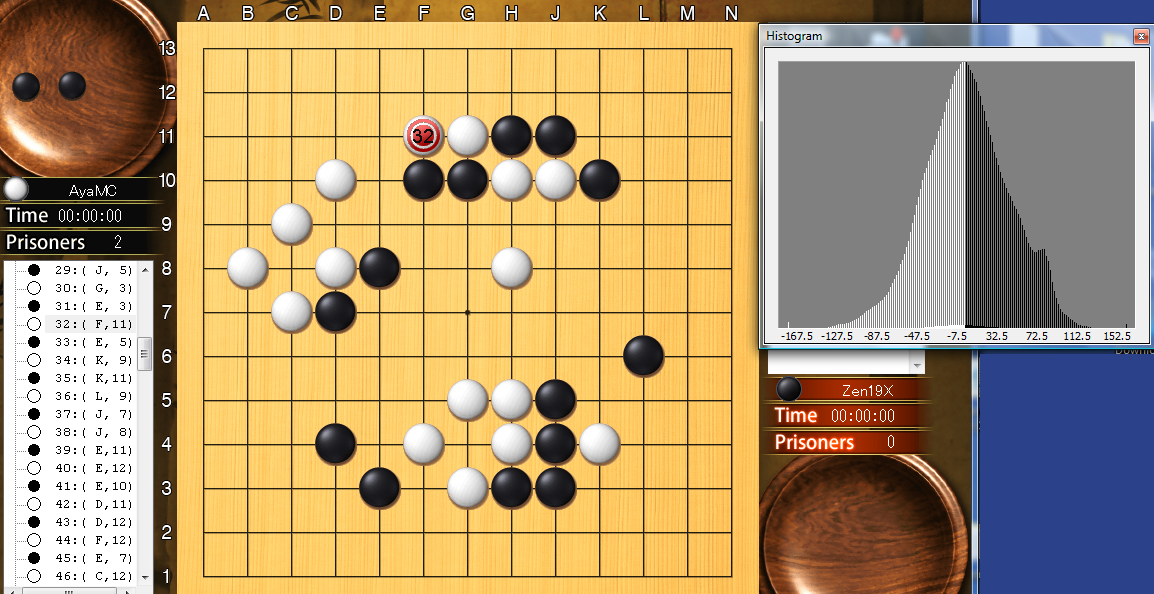
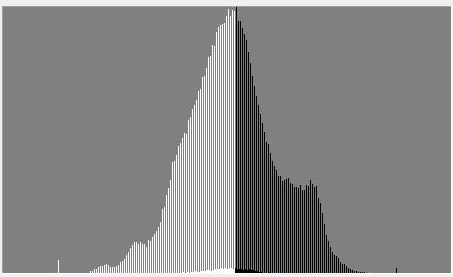
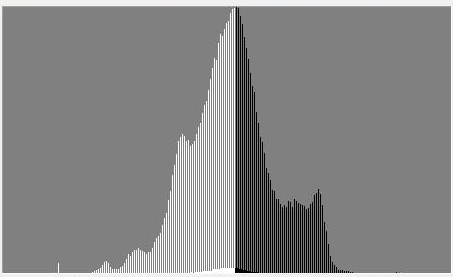
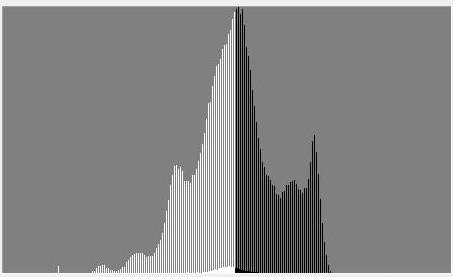
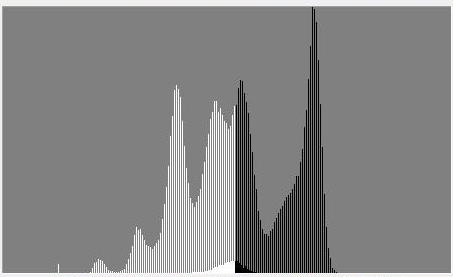
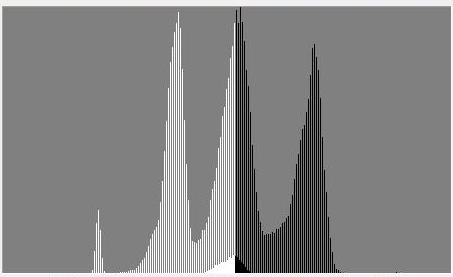
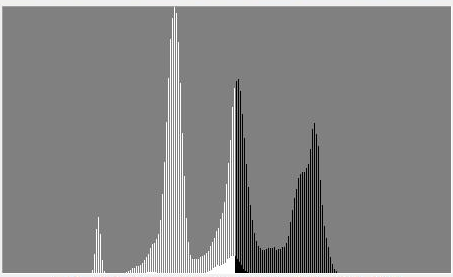
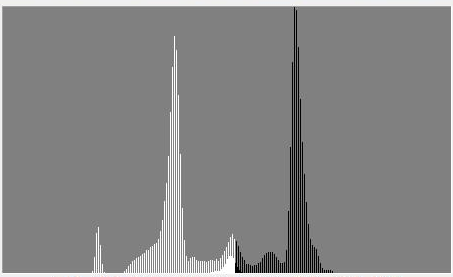
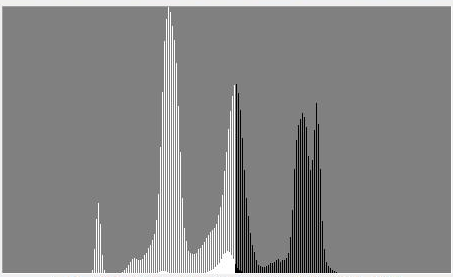
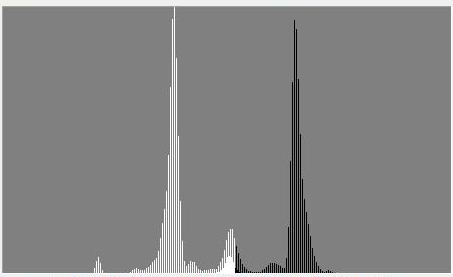
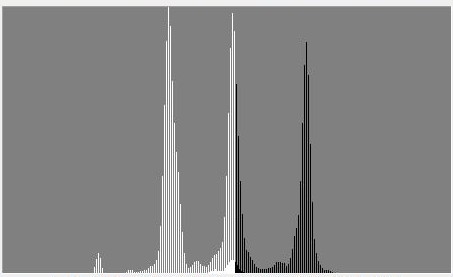
Position after move 32. The histogram is on the right side.
On the x-axis the possible scores are marked. On the y-axis
frequencies of outcomes are indicated. CrazyStone is doing automatic
scaling of the histogram such that the highest bar reaches exactly the upper rim.
Each Monte Carlo playout gives a score between -169 + 7.5 (best possible outcome
for White) and + 169 - 7.5 (best possible outcome for Black). The height of a
bar (for a certain score) stands for the number of playouts with this outcome.
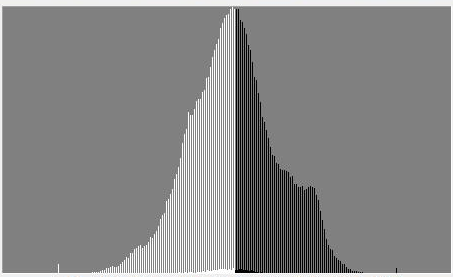
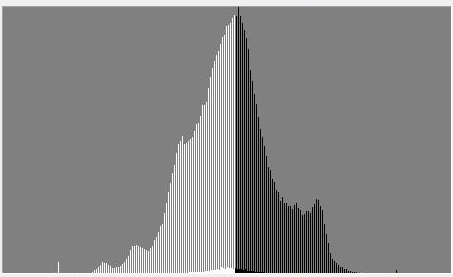
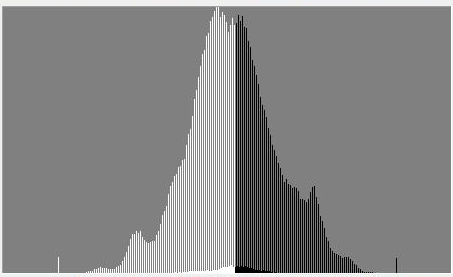
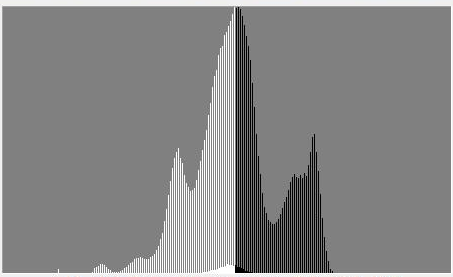
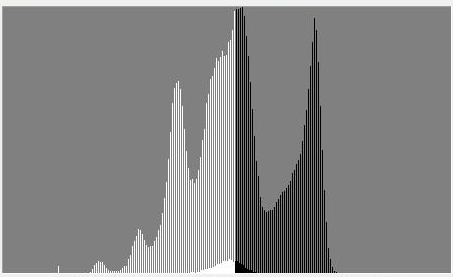
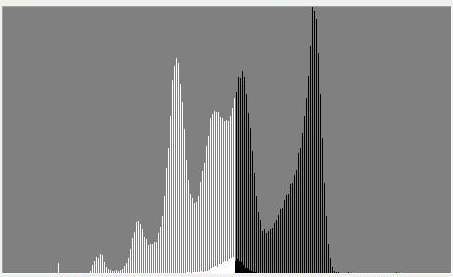
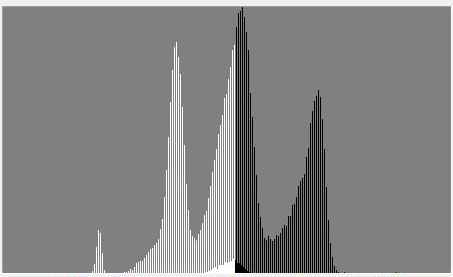
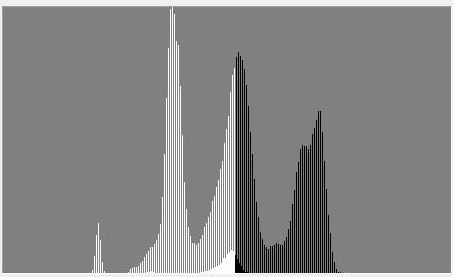
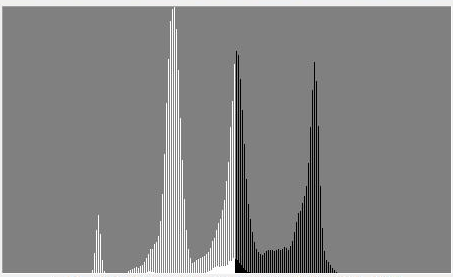
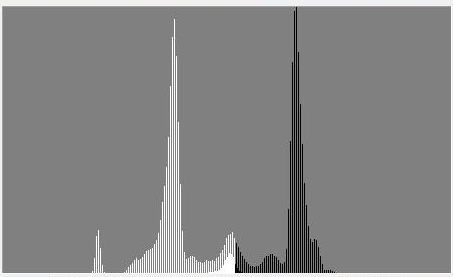
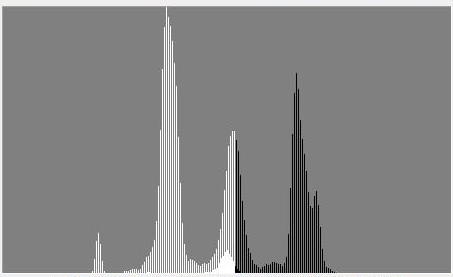
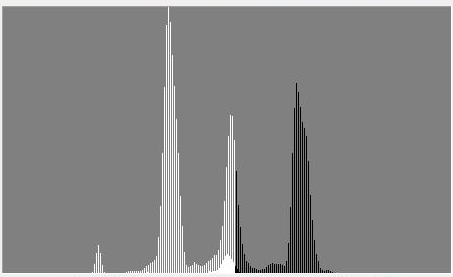
after move 33
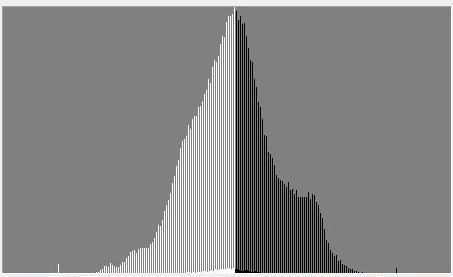
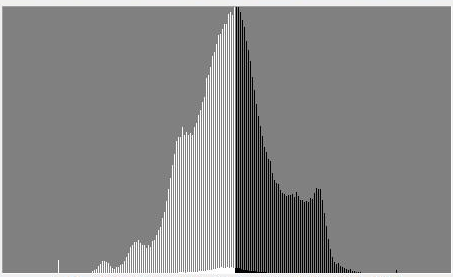
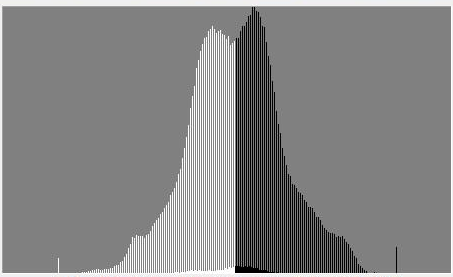
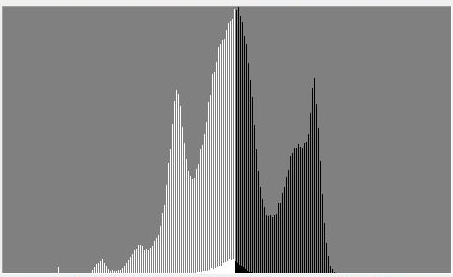
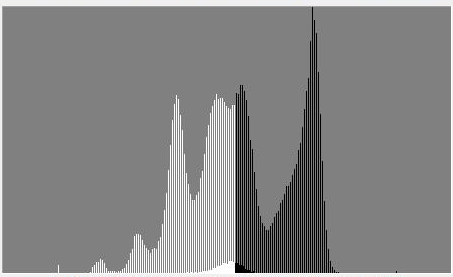
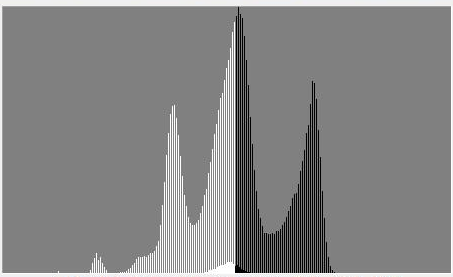
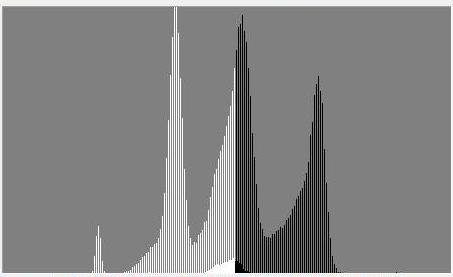
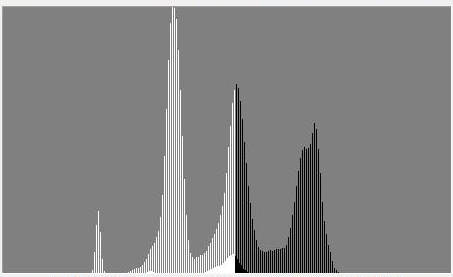
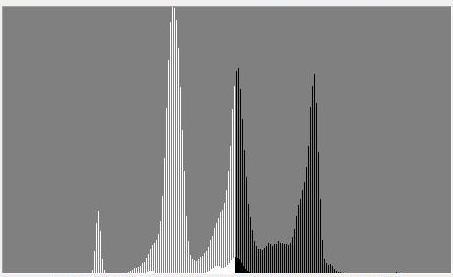
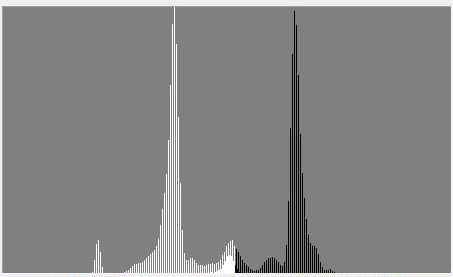
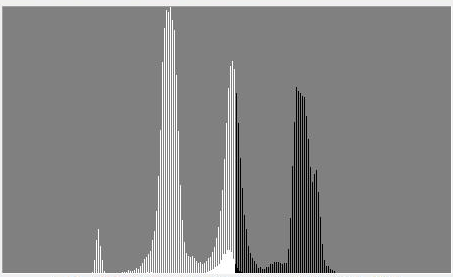
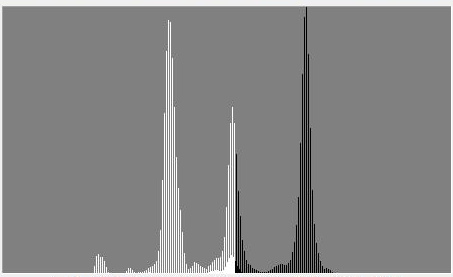
after move 34
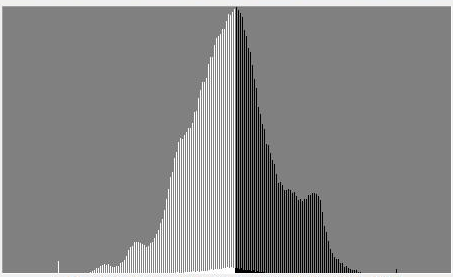
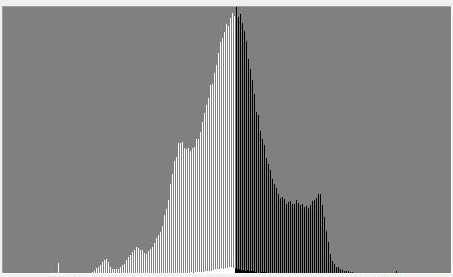
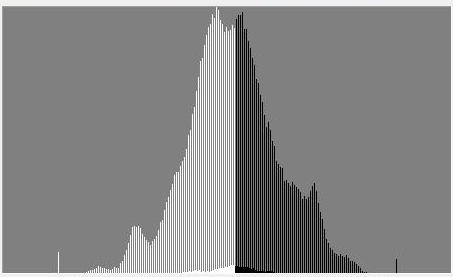
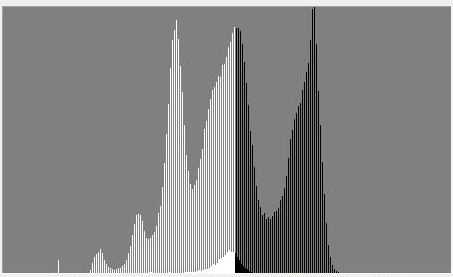
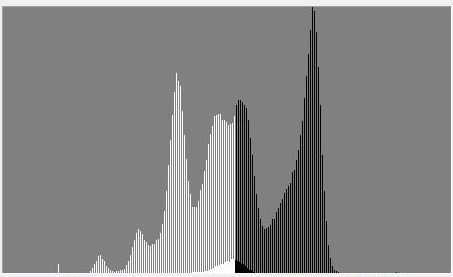
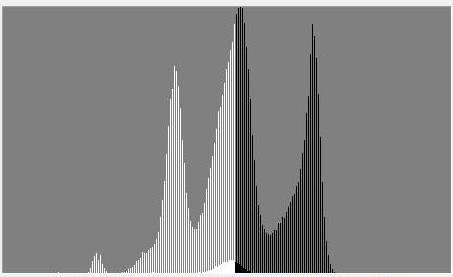
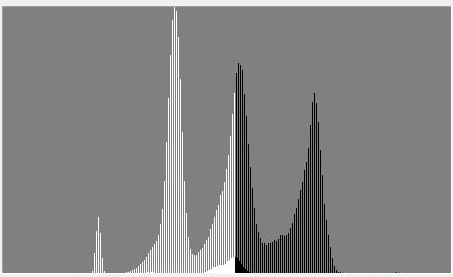
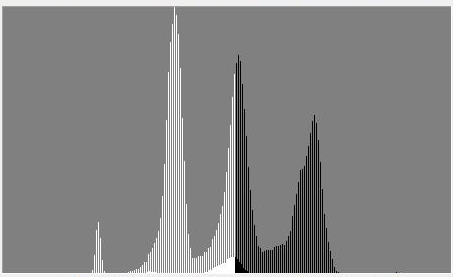
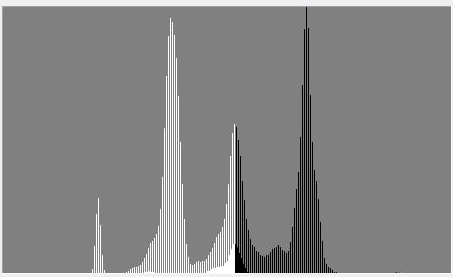
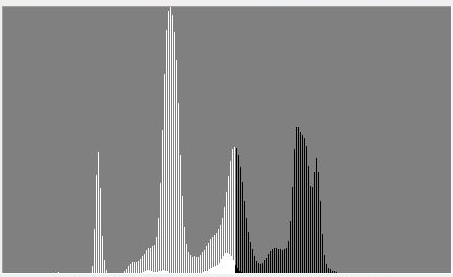
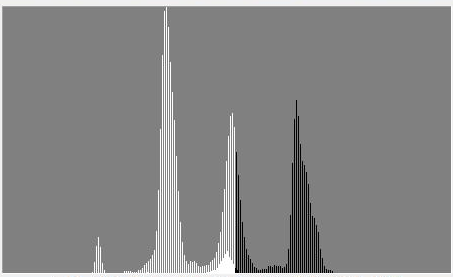
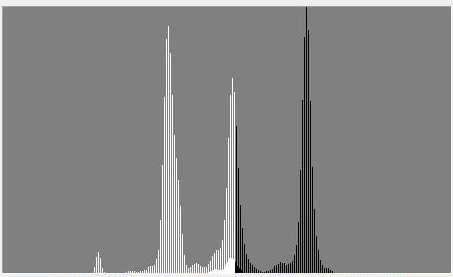
after move 35
after move 36

after move 37

after move 38
after move 39
after move 40
after move 41
after move 42
after move 43
after move 44
after move 45
after move 46
after move 47
after move 48
after move 49
after move 50
after move 51
after move 52
after move 53
after move 54
after move 55
after move 56
after move 57
after move 58
after move 59
after move 60
after move 61
after move 62
after move 63
after move 64
after move 65
after move 66
after move 67
after move 68
after move 69

after move 70

after move 71
after move 72
after move 73
after move 74
after move 75
after move 76
after move 77
after move 78
after move 79
after move 80
after move 81
after move 82
after move 83
after move 84
Back to the main site of althofer.de