Visualisations of Candidate Moves
in Game Tree Search
Most recent update from April 2019
Interactive (human + computer) game play has achieved
impressive successes in the last few decades. In
most
"teams" the computers are used to generate sets of
candidate
moves and to present them in such a way that
the human
boss finds it easy to select his or her
favorite move.
Several good screen layouts have been realized.
See the
examples below: first a series for Monte-Carlo
game tree
searches in Go, Hex, and Havannah; in the second part
some k-best visualisations
for alpha-beta search with
iterative deepening.
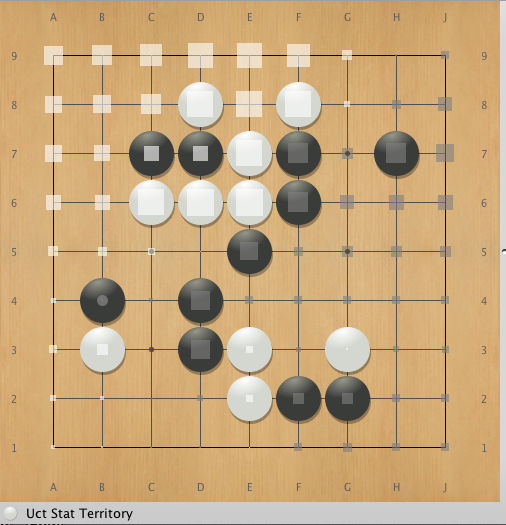
Valkyria is a private go program,
authored by
Magnus Persson.
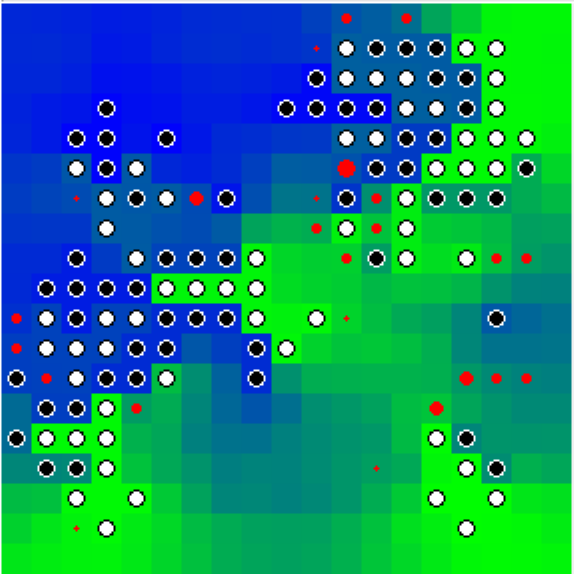
In October 2010, Persson designed
a very informative
visualisation of Valkyria's Monte
Carlo search process:
in one diagram he put the expected
territory distribution
(like in Fuego, see below)
plus
information how
often each candidate move was visited in
the process.
Concerning territory, green means ownership for White and
blue for Black.
Red circles of different sizes indicate the
number of
visits. The radii of circles are proportional to
the ratio
logarithm(visits) / logarithm(max-visits). Persson first used
visits/max-visits
but then only the moves searched a lot
became visible. In the example,
the largest circle is 1578
visits and the smallest is 9 visits. The
medium sized are
about 150-700 visits. In the position, Black is
to move.
Persson did not include win rates in the diagram
because
win rates tend to be either unreliable (move was not
searched
much) and because all top candidates tend to have
rather similar
win rates.
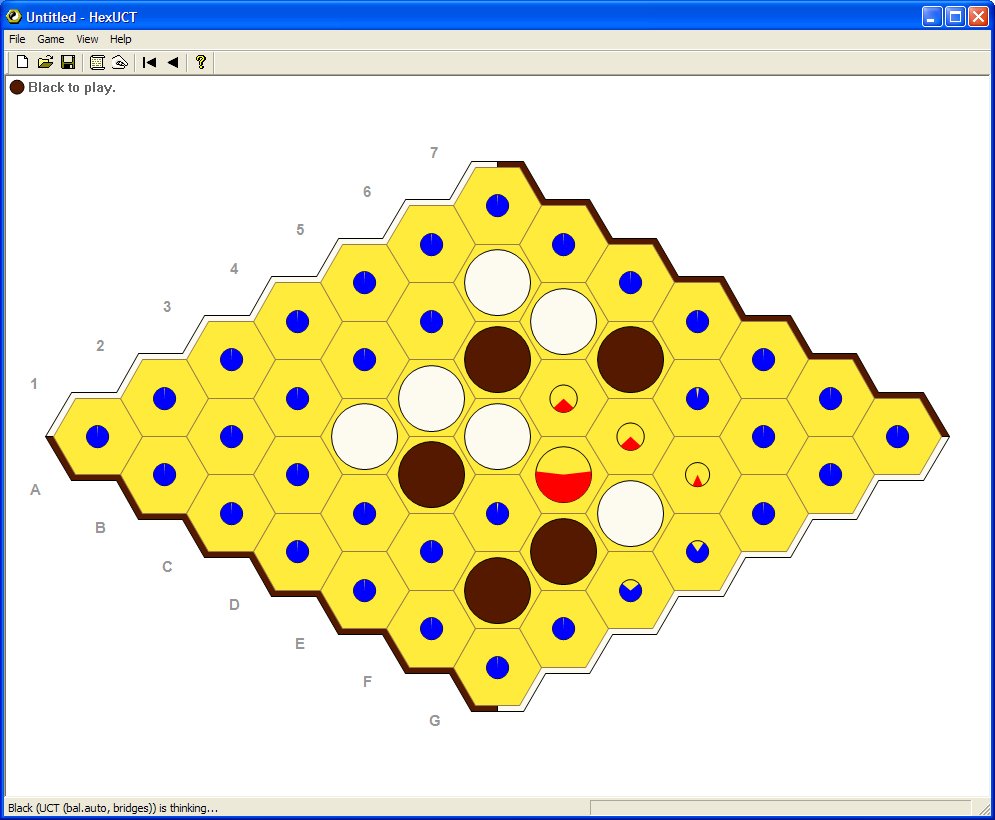
This picture belongs to a Hex program, based on UCT
search
(author Cameron Browne, Summer 2010).
The screen shot
shows the different aspects of the
visualisation. There is one
obviously good move (at square E4).
The large circle there means
that UCT has correctly focussed
most of its search time on that
cell. The fact that the big
red pie slice covers more than 50%
of the circle means that
the algorithm is reasonably confident
of this move (pie area
is based on reward percentage).
The red pie slices are positive (winning) estimates and the
blue
pie slices are negative (losing) estimates, hence the
algorithm is
very confident that all but the four red moves
are almost certainly
losing
moves. If the algorithm searched for longer on the cells
with the
three small red pie slices, the red slices would shrink then
become blue as their true negative value is realised.
Circle radius is based on the number of times that each node (move)
has been visited. This is
an exponential scale, so
that nodes
visited only a few times have inflated radii
and are still visible.
As the number of visits to a node approaches 1,000,000 then
its size
will approach the standard piece size.
This way to visualize a UCT search may be applicable to
many games
(including Go) where a move consists of
a piece being placed on a free
cell of the board.
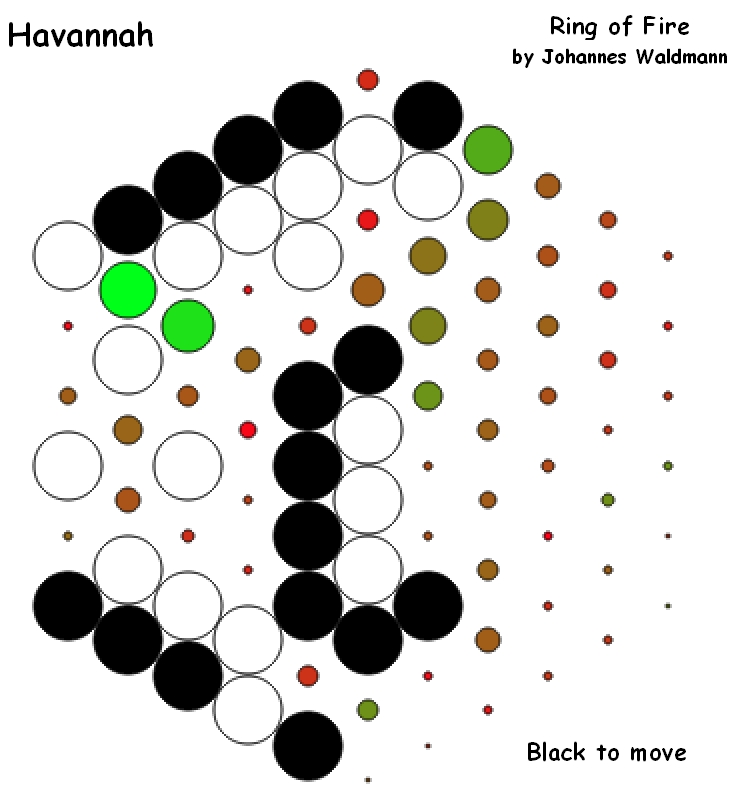
Ring of Fire was a program for the game
Havannah.
In October 2010, RoF-author Johannes
Waldmann from Leipzig
chose the following way
(somewhat different from Cameron Browne's)
to visualize
the candidates of Monte-Carlo tree search:
The Havannah board is hexagonal, size 6 in this example.
Black and White
are stones, already placed by the two players.
In the diagram Black is
to move.
Candidate moves are shown by blobs with different colors
(between green
and red) and different sizes.
The color of a blob is the move value
(green = good, red = bad),
and the size of a blob indicates the number
of visits (large = many).
Colors are normalized (the best value is
always pure green,
no matter how bad it actually is), and visit counts
are logarithmic.
When Johannes Waldmann presented this solution in the
Havannah/Hex
forum of www.littlegolem.net, he gave a promise:
"Yes, I will make the blobs click-able
(to allow the user to walk
in the search tree)."
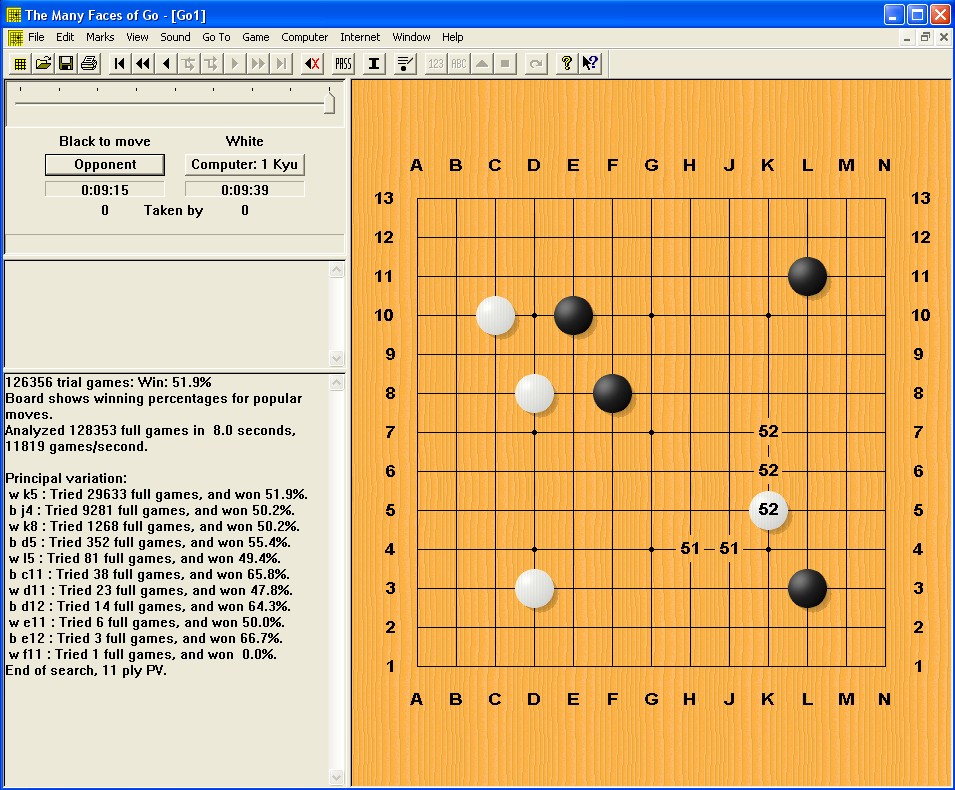
Go program Many Faces of Go, version 12.013
from July
2009 (author David Fotland).
This was the first realisation of
a multi-best mode for a
game playing program that is based on
Monte Carlo Tree Search.
The program shows a variable number of "popular" moves.
The numbers in
the board indicate the candidate moves.
The values are the Monte Carlo
scores for these moves,
rounded to full percent.
In the lower left part
of the window the principal variation
for the best move (k5 in the example)
is shown. Typically,
only the first 3-5 moves of this line can be
"interpreted" seriously.
Fuego is a go program, using Monte-Carlo tree search.
The initial version of the code was released by the
Computer
Go Group at the University of Alberta. Fuego
is available
under the terms of the GNU Lesser General
Public License.
Members of the Fuego team were
(in October 2010):
Markus Enzenberger,
Martin Müller, Broderick Arneson,
Richard Segal,
Gerald Tesauro, Arpad Rimmel.
In certain periods also David Silver and Aya Huang the Go-programming
heros of DeepMind ("Alpha-Go") in 2015 and 2016 were also
in this group.
Fuego has a routine that does not show values of moves
but
how often a square will finally end in the territory
of Black
and White, respectively.
The size of the white and dark grey
squares represents the percentage
of playouts that ended up
with that point being territory for that
color. For example,
a large white square means that white almost
always owned
this point, while a small grey square means that black
owned
it only slightly more often than white. The exact values are
scaled from -1 (always white) to +1 (always black).
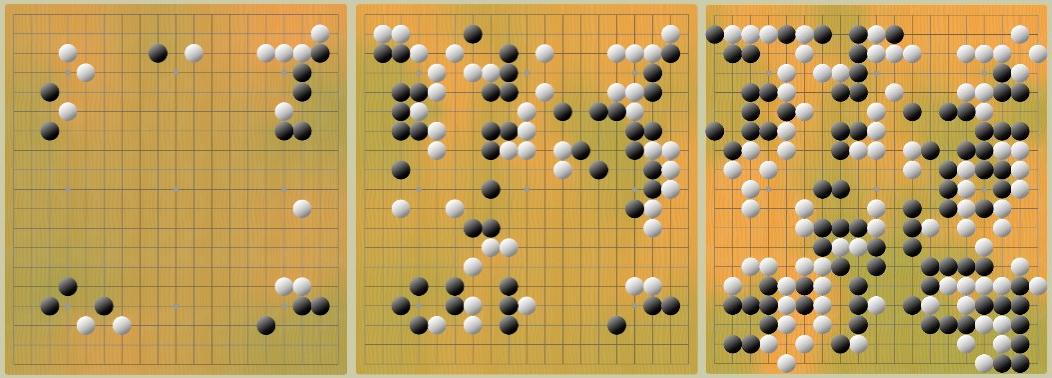
Jonathan Chetwynd used the Fuego routine to generate
another type of colourful pictures showing "expected territory"
in
go positions.
The data describe the probability that either player
may gain each point of territory. Reddish color means
higher
probability for becoming white territory. Green
means higher
probability for becoming black territory.
(This may be a problem
for color-blind people.)
The data were normalised and converted to two dimensional gradients
using linear interpolation or lerp.
Scaleable Vector Graphics (SVG)
is used to display the combined
image in the browser.
**********
Solutions from before the ages of Monte Carlo game tree search
**********
K-best search in game trees gives the user not only
the
single best move, but a list with the k best move
candidates.
Here "best" is always meant with respect to
the evaluation
function of the program in use.
From the mid 1990's on, several
good screen layouts for k-best
game tree search have been realized.
See the seven examples
below.
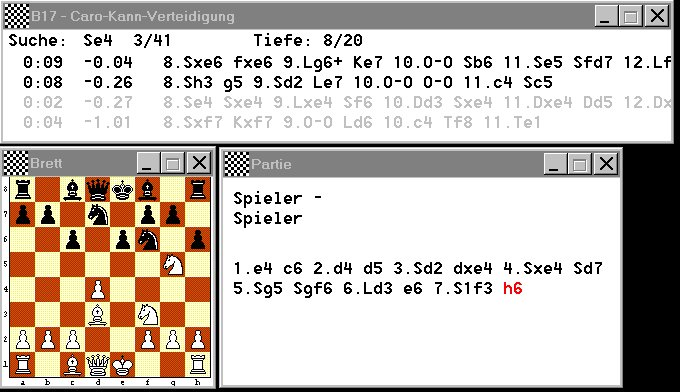
Chess program Shredder in 4-best analysis mode,
version Shredder-3 from 1998 (author Stefan Meyer-Kahlen).
See
this site for
more information on Shredder.
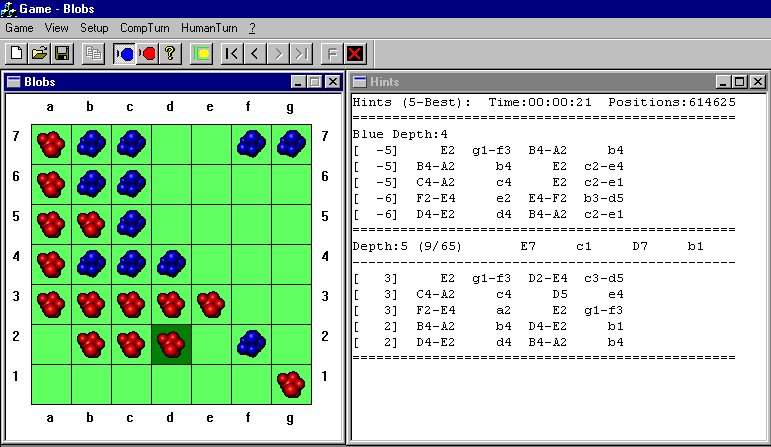
Program for game Blobs, running under Morphling
in 5-best analysis mode,
version from Summer 2002 (author of
Morphling: Thomas Rolle).
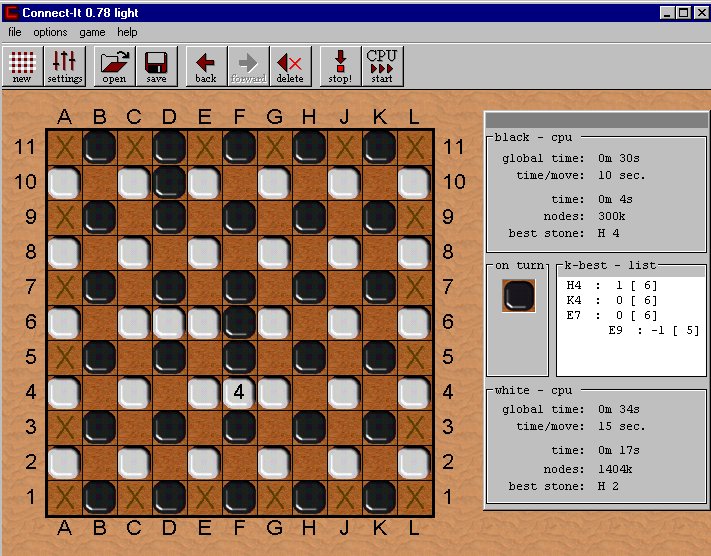
Program Connect-It for Shannon's Switching game,
running
in 4-best analysis mode, version from Summer 2002
(author Jörg Sameith).
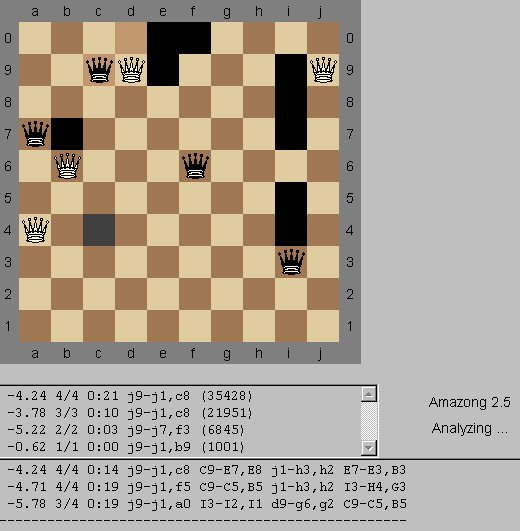
Amazons program Amazong in 3-best analysis mode,
version 2.5 from Summer
2002 (author Jens Lieberum).
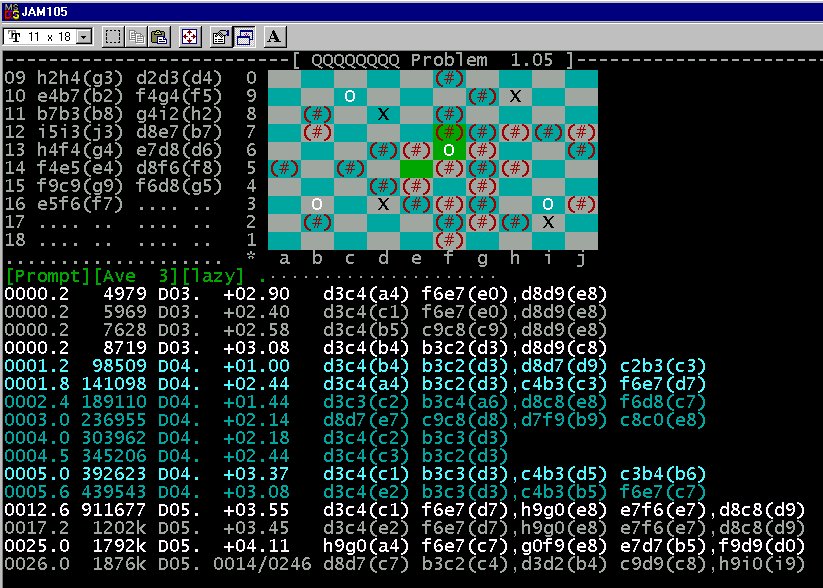
Amazons program 8QP in 2-best analysis mode,
version
1.05 from Summer 2002 (author Johan de Koning).
Intermediate candidate moves are not deleted but remain on
the screen.
Top candidates are shown in lighter colours.
A report on the k-best-visualisations was published in the
ICGA Journal, Volume 26 (2003), pp. 182-189.
(Title: "Five visualisations of the k-best mode";
authored by
Ingo Althöfer, Johan de Koning, Jens
Lieberum,
Stefan Meyer-Kahlen, Thomas Rolle, Jörg Sameith.)
A low quality copy of this report can be found online here:
p.182
p.183
p.184
p.185
p.186
p.187
p.188
p.189
Keep in mind that this report was written before the
upcoming of Monte Carlo game tree search.
Feel free to contact Ingo Althöfer when you know about other nice
realizations of k-best game tree search.
Back to the main site of Ingo Althöfer